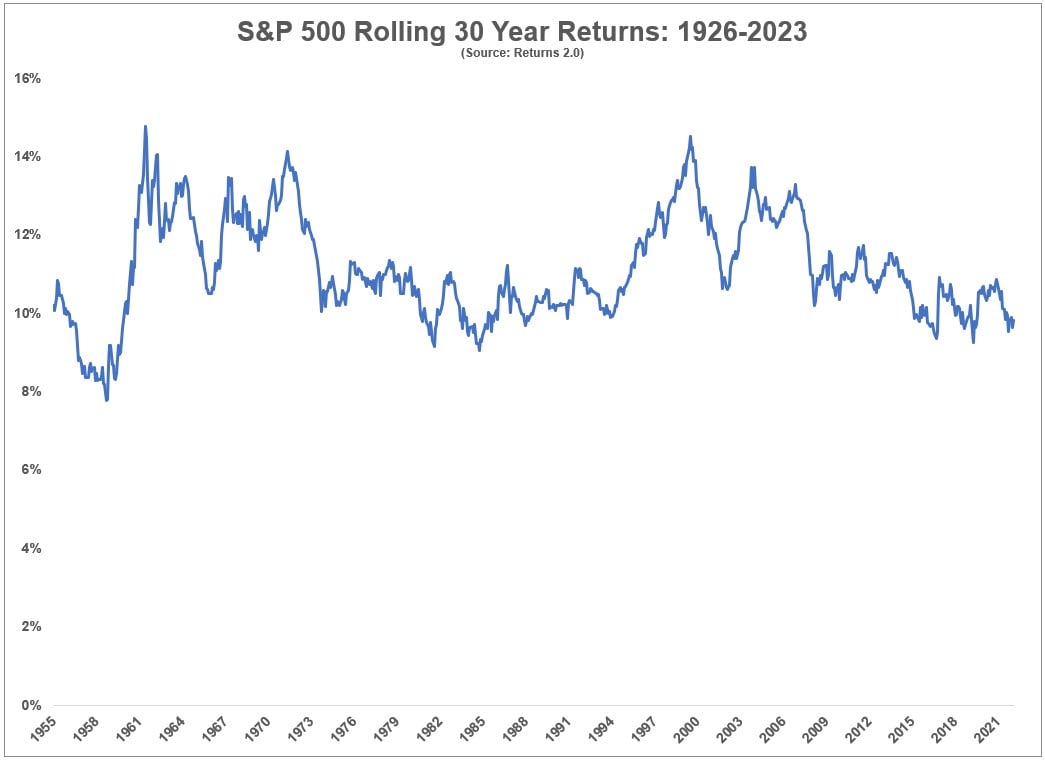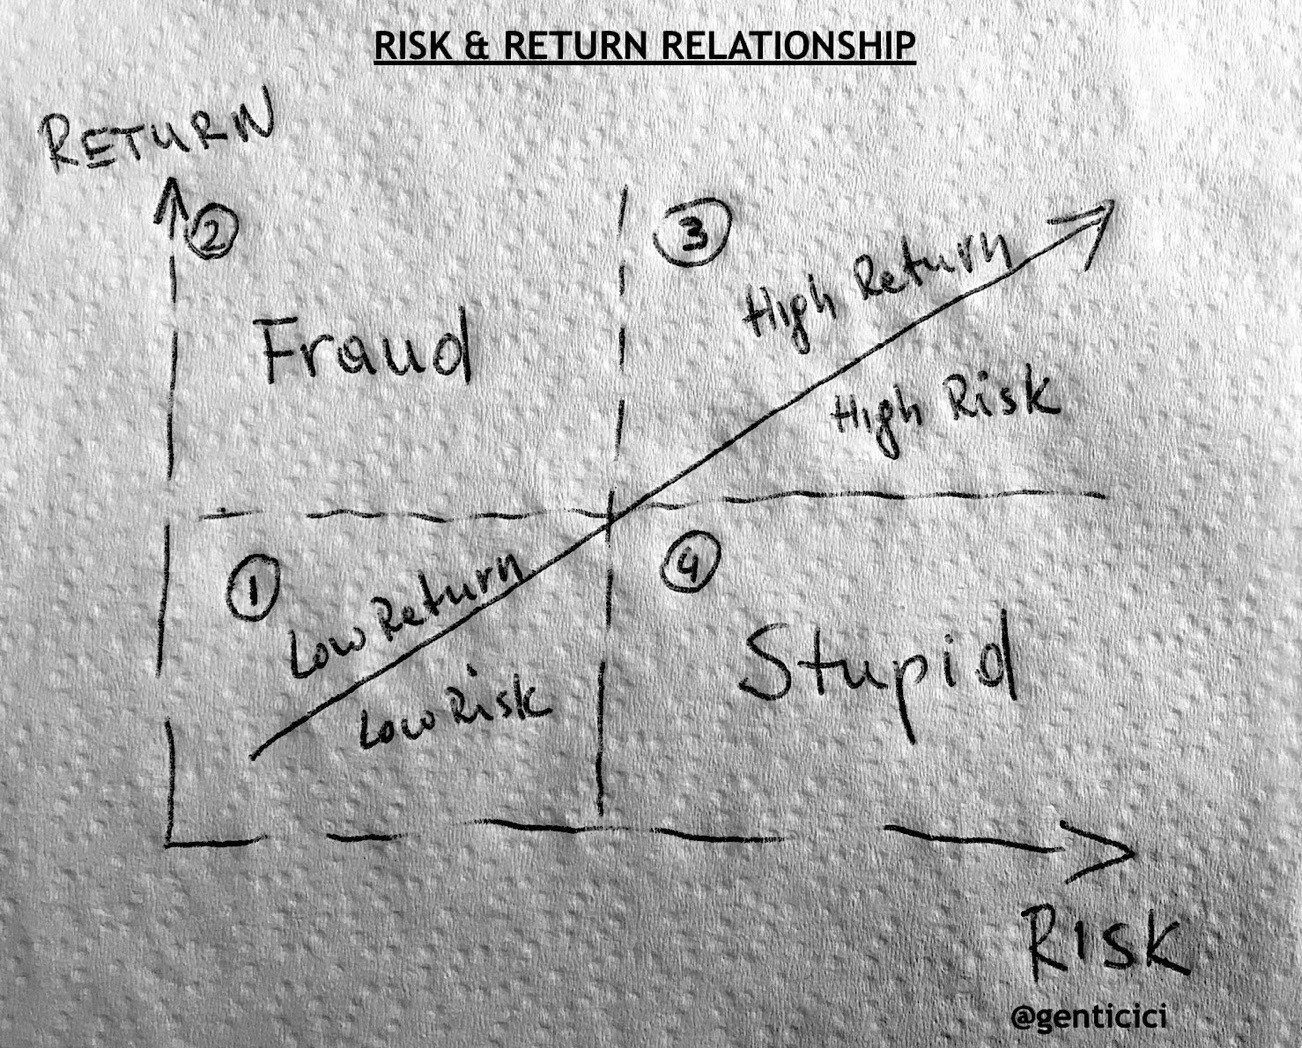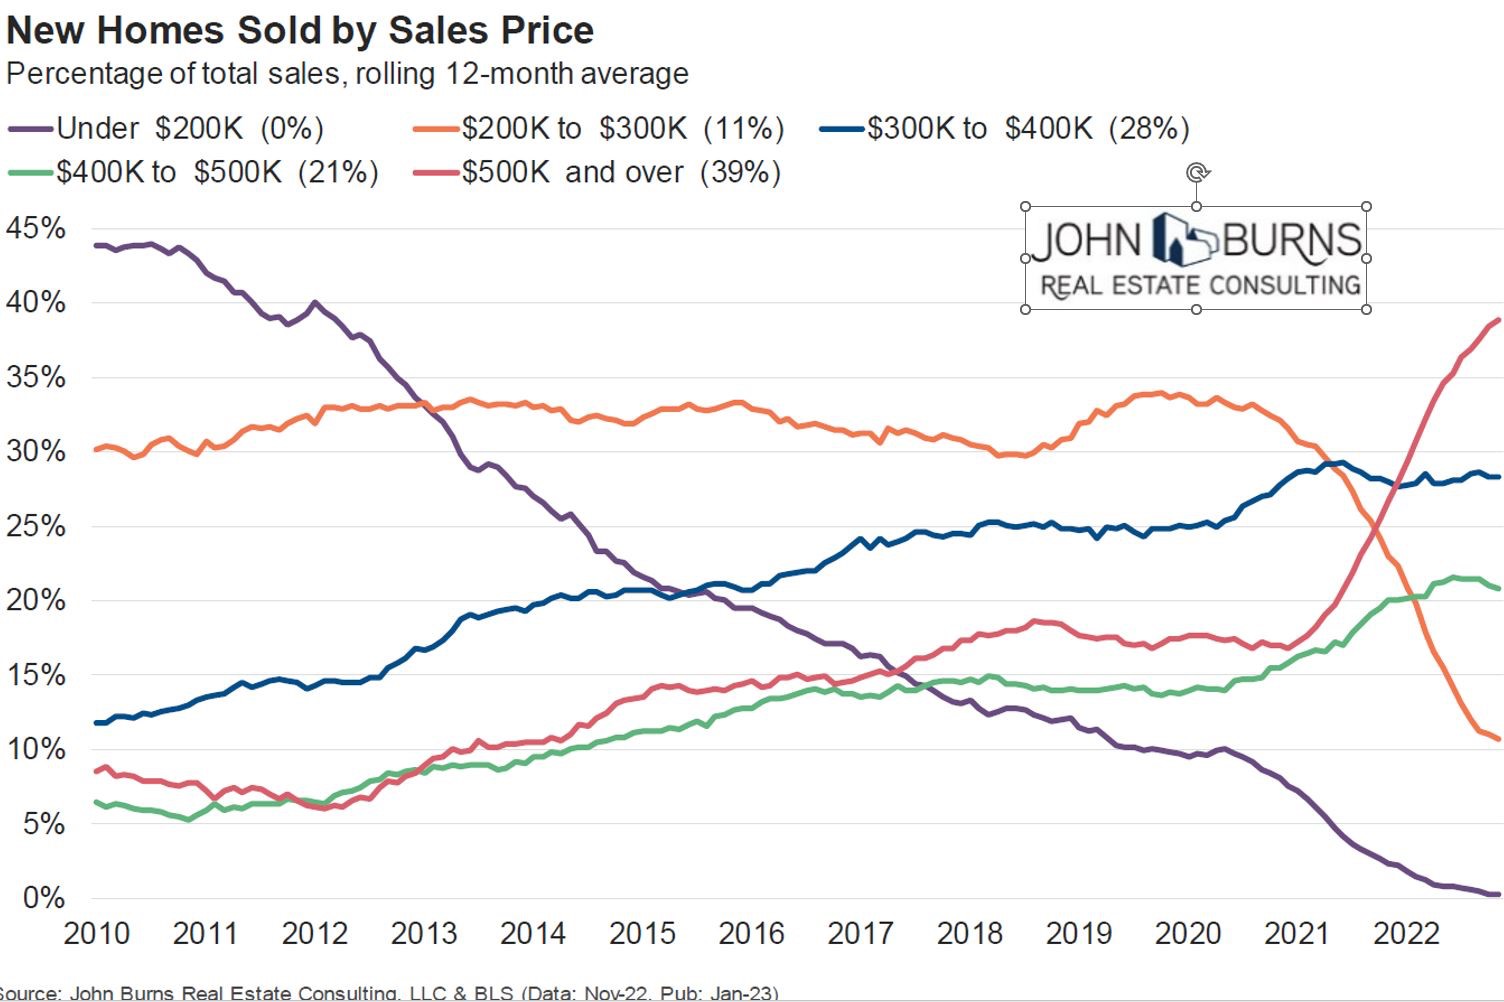
Chart of the Day (8)
Chart of the Day: Home Changes in 2023
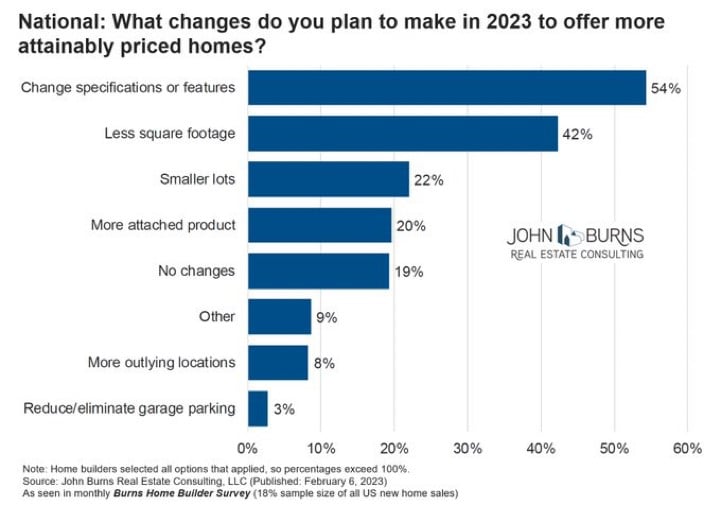
Today’s Chart of the Day is a survey of builders with data provided by John Burns Real Estate Consulting.
Read