Contact Us
    Browse by topic
    Subscribe to our blog

    Chart of the Day

    Faith in the Long Run

    Today’s Chart of the Day shows the S&P 500 index with recessions marked in red going all the way back to 1928.
    Read

    Chart of the Day

    The Crypto Hedge?

    So far this year, we have experienced the longest “downturn” in terms of time since our last record high during The Great Recession.
    Read

    Chart of the Day

    Beyond Profits

    Today’s Chart of the Day shows the price of $100 invested in Beyond Meat, Inc. when the company went public in early 2019.
    Read

    Chart of the Day

    Mid-Year Index vs. Active Update

    Twice a year, S&P Dow Jones updates their SPIVA (S&P Indices Versus Active) report.
    Read

    Chart of the Day

    Inflation vs. Stocks and Bonds

    Today’s Chart of the Day comes from S&P Dow Jones Indices.
    Read

    Chart of the Day

    45% to 59% Overvalue of Real Estate?

    Today’s chart comes from Fortune, which shows the real estate markets that are “overvalued” based on the area's local incomes and construction costs.
    Read

    Chart of the Day

    With Bonds All Things Are Equal

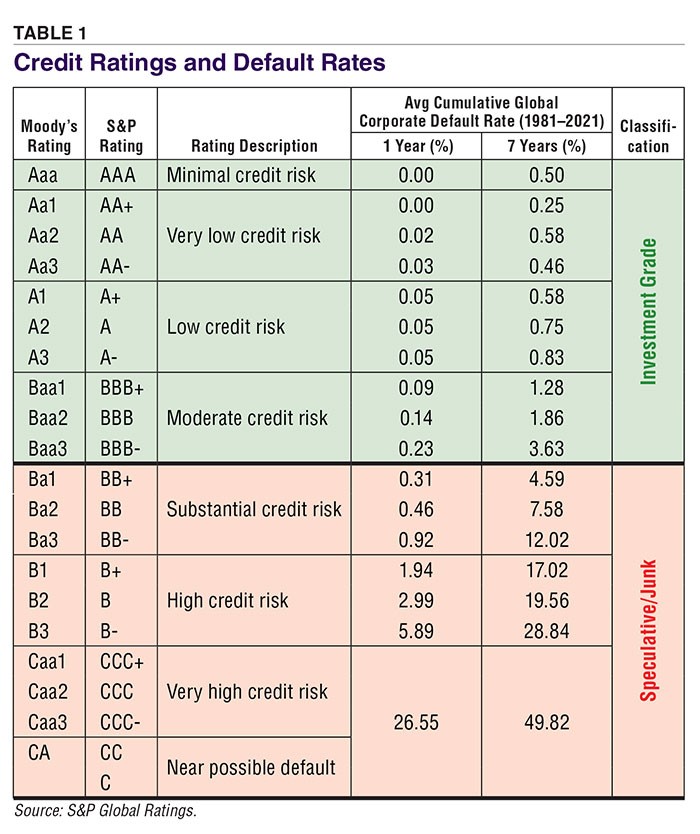
    Today's Chart of the Day comes from an article in AAII.com (American Association of Individual Investors) and shows the average cumulative global corporate default rate from 1981-2021 in seven year spans. A common misconception is that the yield you see from a bond portfolio is what you can expect to earn. However, this is a best case scenario as some of the bonds will ultimately default, causing a loss that reduces the yield. In rough figures, if you take the weighted average default rate of all speculative/junk bonds and assume a 50% loss of principal of those bonds, over seven years this can reduce your total return by 2.9% annually. The current yield to maturity on speculative/junk bonds is 7.6%. When you add in the historical loss of 2.9%, this reduces the total return to 4.7%, which happens to be the same yield of 4.7% in an investment grade bond with a similar maturity.
    Read

    Chart of the Day

    Percentages On-Time

    The Chart of the Day comes from Bloomberg. It's not a necessarily a financial chart, but instead shows percentages of on-time flights, and the amount of passengers traveled per airline.
    Read

    Managing your Wealth

    Requirements to Qualify for an SBA 504 Loan

    Small Business Administration (SBA) 504 loans offer affordable financing to small businesses for financing large equipment or real estate purchases. Because of their low interest rates and long loan terms, this type of small business loan is an ideal option for owners who need to make large purchases.
    Read

    Chart of the Day

    Moving the Goalposts

    Today's chart appears in a research paper titled, “Moving the Goalposts? Mutual Fund Benchmark Changes and Performance Manipulation” which was referenced in an article from the Wall Street Journal the week of August 22. The paper denotes that 37% of all actively managed mutual fund managers changed their benchmarks between 2006 and 2018, and two-thirds of these changes made the funds appear to improve their performance.
    Read

    Want more articles like this in your inbox?

    Subscribe to our blog for a weekly roundup of our latest financial blogs and resources.