Contact Us
    Browse by topic
    Subscribe to our blog

    Chart of the Day

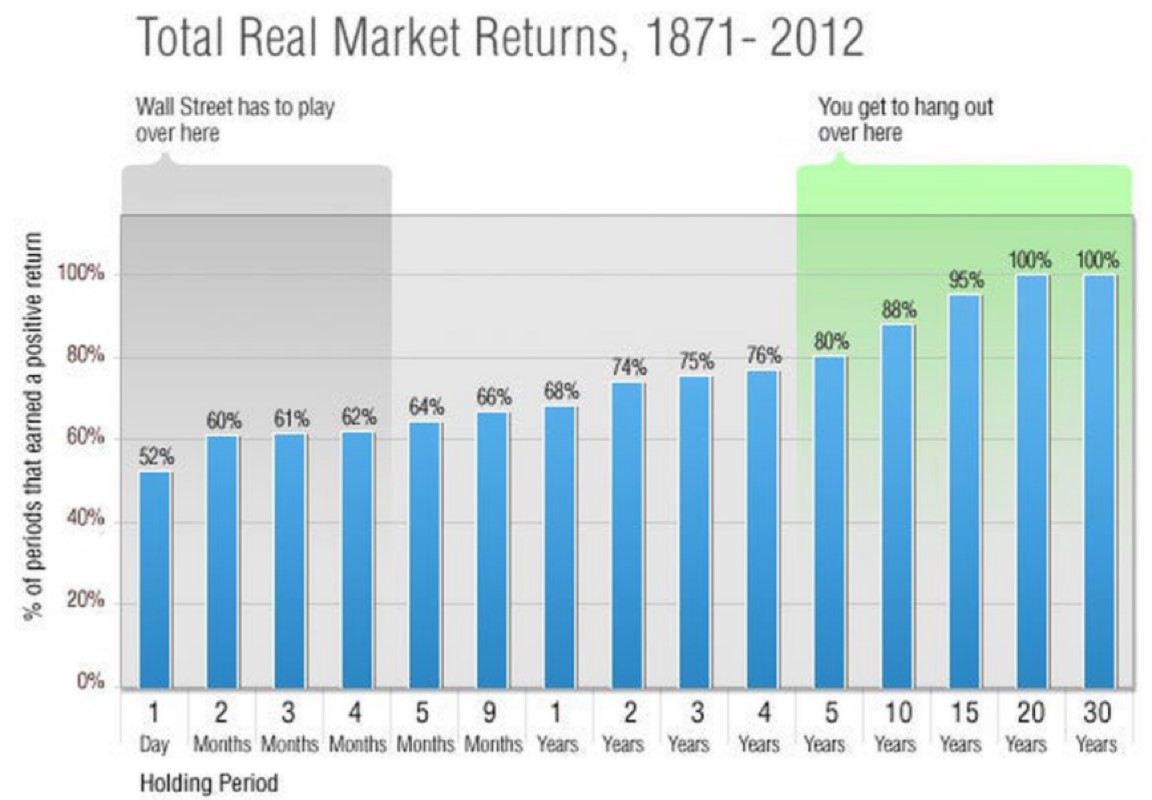
    Chart of the Day: Better than 50/50, Especially in the Long Run

    Today’s Chart of the Day from @morganhousel on Twitter illustrates the odds that you will have a positive return in the stock market based on how long you own stocks.
    Read

    Chart of the Day

    Chart of the Day: Record Car Prices

    Today’s Chart of the Day is from a CNBC article titled, “With just 8% of new vehicles costing under $30,000, ‘it’s the least affordable car market in modern history,' expert says.”
    Read

    Chart of the Day

    Chart of the Day: A Productive US vs. the UK/Japan

    Today’s Chart of the Day from Invesco’s mid-year outlook shows that high inflation is reducing household disposable income. A closer look shows another interesting note: $100 worth of income in the United States in 1999 is now $170 in 2022, an impressive 70% increase.
    Read

    Chart of the Day

    Chart of the Day: Dollar Reign

    Today’s Chart of the Day comes from the Financial Times and shows the dominance of the US dollar in central bank reserves globally, represented in dark blue.
    Read

    Chart of the Day

    Chart of the Day: Post-Pandemic Trips

    Today’s Chart of the Day is from the Wall Street Journal. Some things have not gone back to “pre-pandemic” days. One is the percentage of those who continue to work from home.
    Read

    Chart of the Day

    Chart of the Day: Buying vs. Renting

    Today’s Chart of the Day comes from re:venture in a discussion on Reddit. It's important to remember that the monthly cost to buy (yellow) is usually more than the cost to rent (blue), but a large difference between the two is not sustainable.
    Read

    Chart of the Day

    Chart of the Day: Equal Weight for an Even More Incredible Win

    Today’s Chart of the Day is from S&P Global. If you follow my posts, you will not be surprised that over the last 20 years the S&P 500 index, where larger companies make up more of the index than smaller ones, beat actively managed funds an incredible 92.4% of the time. That is a high bar to beat.
    Read

    Chart of the Day

    Chart of the Day: US Birth Rates

    Today’s Chart of the Day from Econofact.org shows the trend in US birth rates which peaked in 2007 and is now 20% less.
    Read

    Chart of the Day

    Commentary of the Day: NASDAQ 100 Concentration

    Today’s Chart of the Day is a comment about a unique risk that can occur in successful index funds. For instance, we often hear about what many call the “Tech-Heavy NASDAQ” which refers to the Invesco QQQ Trust Exchange Traded Fund (ETF), the 5th largest exchange-traded fund in the US.
    Read

    Chart of the Day

    Chart of the Day: Winners May Not Always be Winners

    Today’s Chart of the Day comes from A Wealth of Common Sense and shows the top 10 companies in the stock market going back to 1980.
    Read

    Want more articles like this in your inbox?

    Subscribe to our blog for a weekly roundup of our latest financial blogs and resources.