Chart of the Day: Better than 50/50, Especially in the Long Run
Contents
About the Author

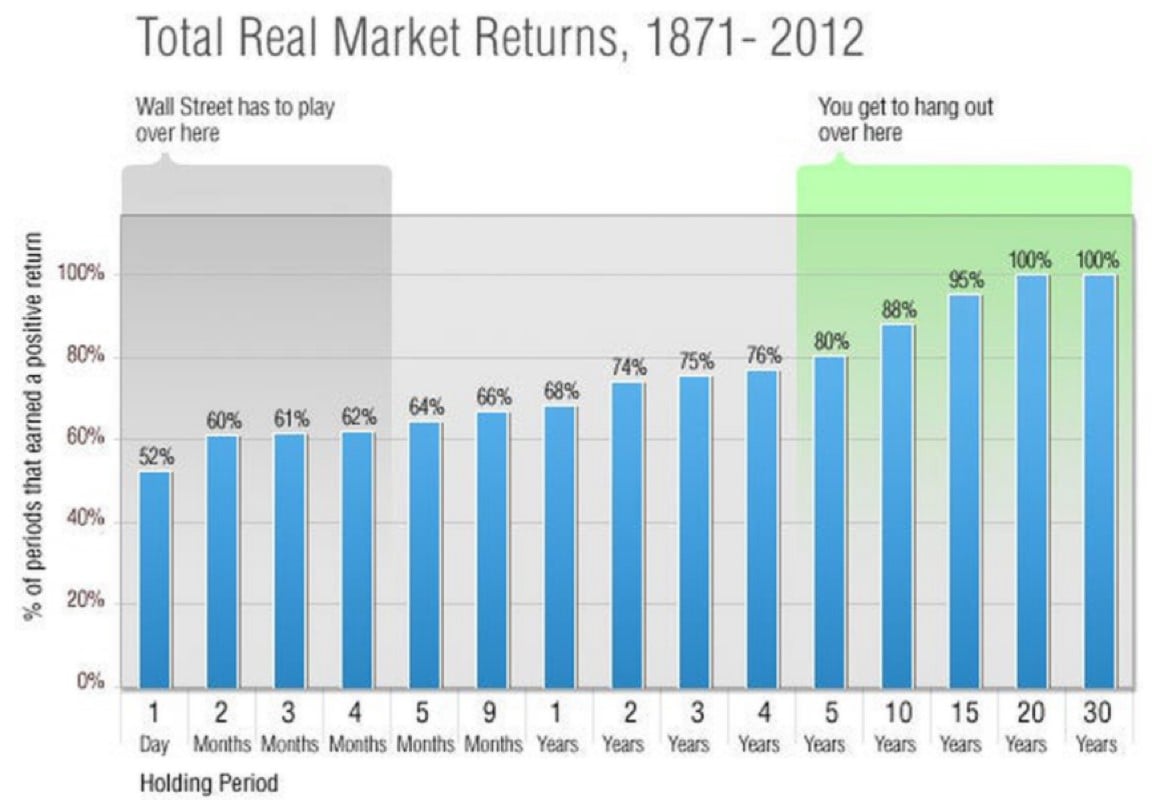
Today’s Chart of the Day from @morganhousel on Twitter illustrates the odds that you will have a positive return in the stock market based on how long you own stocks. Quite simply, the longer you hold, the better chance you have. There is a lot of randomness day-to-day, with only a 52% chance to have a positive return after one day. By contrast, buy-and-hold investors have historically seen higher returns which have reached an 88% chance when stocks are held for 10 years or an even more impressive 100% chance over 20+ years.
Samuel serves as Senior Vice President, Chief Investment Officer for the Crews family of banks. He manages the individual investment holdings of his clients, including individuals, families, foundations, and institutions throughout the State of Florida. Samuel has been involved in banking since 1996 and has more than 20 years experience working in wealth management.
Investments are not a deposit or other obligation of, or guaranteed by, the bank, are not FDIC insured, not insured by any federal government agency, and are subject to investment risks, including possible loss of principal.