Contact Us
    Browse by topic
    Subscribe to our blog

    Chart of the Day

    Chart of the Day: Five Years in Real Estate

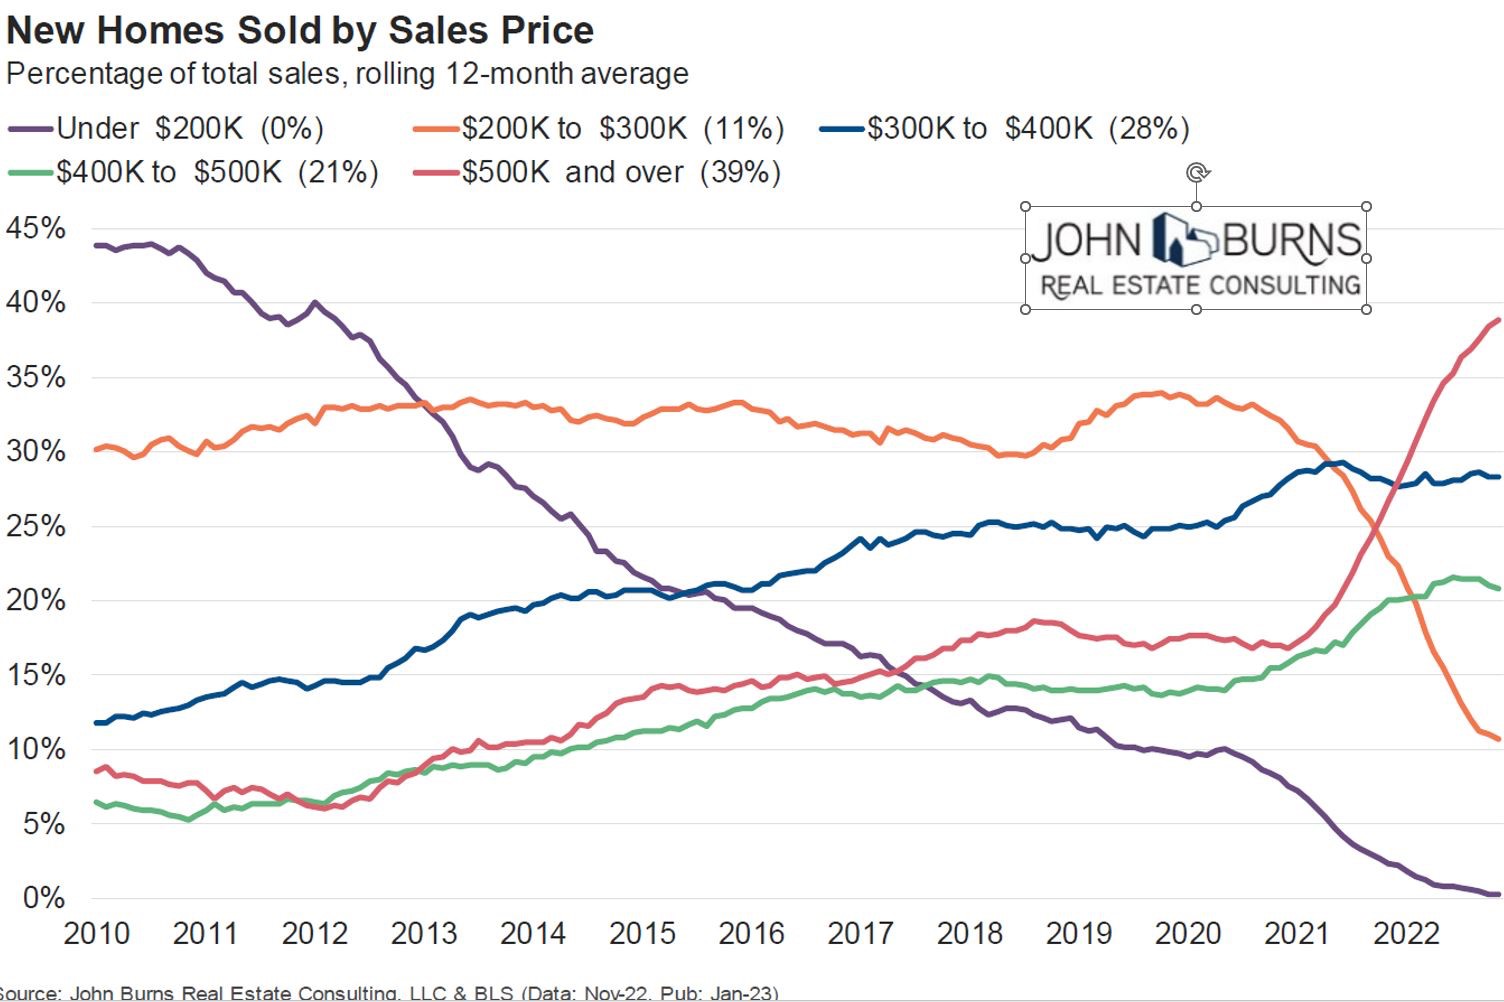
    Today’s Chart of the Day comes from John Burns and shows the historical percentages of homes sold by sales price going back to 2010.
    Read

    Chart of the Day

    Chart of the Day: Auto Supply

    Today’s Chart of the Day comes from Wolfstreet and shows the supply of new vehicles in number of days.
    Read

    Chart of the Day

    Chart of the Day: Not Going Away

    Today’s Chart of the Day is the projected budget deficits for the next 10 years provided by the Congressional Budget Office. It is not a rosy picture.
    Read

    Chart of the Day

    Chart of the Day: Time in the Market

    Today’s Chart of the Day comes from @PeterMallouk on Twitter and shows the percent of time the S&P 500 is positive, depending on your holding period, going all the way back to 1928.
    Read

    Chart of the Day

    Chart of the Day: Save Early and Save Often

    Today’s Chart of the Day is from the Federal Reserve Bank of St. Louis supporting the mantra, "Save early, Save often."
    Read

    Chart of the Day

    Chart of the Day: Half in our Grandchildren's Lifetime

    Today’s Chart of the Day comes from chartr with data provided by the United Nations.
    Read

    Celebrity Estate Planning Mistakes to Avoid

    Whether it’s fear of thinking about the end of life or they just don’t believe they have enough money and assets to worry about, only 33% of American adults have an end-of-life plan that describes how their funds and possessions should be distributed after their death. Although, as U.S. adults age, the average increases to 76% of those 65 and older; however, it is estimated that only 20% of those under age 30 have made the necessary arrangements of obtaining a will.
    Read

    Chart of the Day

    Chart of the Day: Music Sales

    Today’s Chart of the Day comes from Statista, a provider of market and consumer data. The chart shows that streaming music, purple, has taken over the music industry.
    Read

    Chart of the Day

    Chart of the Day: Three Years on Average

    Today’s Chart of the Day comes from A Wealth of Commons Sense and shows the number of “bear markets,” years with a 20%+ loss, since World War II. We were awfully close to one in 2022 with a 19% loss.
    Read

    Chart of the Day

    Chart of the Day: Every 2.5 Years

    Today's Chart of the Day comes from A Wealth of Common Sense and shows the annual returns of the stock market since 1928. There were 69 positive years versus 26 negative years. This results in a negative year on average of every 2.5 years. For the last few years, we’ve become used to a string of consecutive positive ones, which has made it tough to remember that negative ones are a normal course of business.
    Read

    Want more articles like this in your inbox?

    Subscribe to our blog for a weekly roundup of our latest financial blogs and resources.